External Range Liquidity by fx4_livingExternal Range Liquidity Indicator
This indicator visualizes the evolving price range boundaries and subdivisions for a user-defined intraday session period on the chart.
It computes and displays the highest and lowest prices observed within the specified session (used as external range liquidity), updating dynamically with each bar, and includes optional midpoint and quartile levels represented by horizontal lines that adjust as the range develops.
Key Features:
Session Range Calculation: Tracks the maximum high and minimum low prices during the active session, refreshing in real-time.
Midpoint Display: Optionally plots a median level between the session high and low, with selectable styles (solid, dotted, or dashed).
Quadrant Display: Optionally segments the range into quarters by displaying levels at 25% and 75% from the low, with customizable line styles.
Color Customization: Allows selection of colors for the high boundary (default blue), low boundary (default red), midpoint (default gray), and quadrants (default gray).
Session Input: User-configurable session timeframe, defaulting to 18:00-16:14 across all weekdays and weekends, using America/New York time zone.
Timeframe Compatibility: Optimized for intraday use on charts of 30 minutes or lower; attempts to apply on higher timeframes will display an error.
Visualization Style: High and low ranges appear as stepped lines with diamond markers indicating external liquidity purges. Midpoint and quadrant lines are horizontal segments without extension for precise session representation.
Settings:
Range: Specifies the session window (e.g., "1800-1614").
High Color: Color for the upper range line.
Low Color: Color for the lower range line.
Show range mid point: Enable/disable the midpoint line.
(Midpoint color and style): Inline choices for color and line type (Solid, Dotted, Dashed).
Show range quadrants: Enable/disable both the 25% and 75% lines.
(Quadrants color and style): choices for color and line type (Solid, Dotted, Dashed).
This tool serves purely for visual analysis of session price dynamics on charts.
It offers no signals, predictions, or guidance for any market actions.
Users are encouraged to perform independent evaluations and align with their own strategies when incorporating charting elements.
Поиск скриптов по запросу "session high"

Sessions & ORB Pro | Bifrost InstituteSessions & ORB Pro | BI
Professional Session Analysis and Opening Range Breakout Tracker
This advanced indicator provides comprehensive session tracking and Opening Range Breakout (ORB) analysis across multiple global trading sessions. Designed for intraday traders, this tool helps identify key support and resistance levels, session volatility patterns, and potential breakout opportunities.
Overview
Session-based trading is crucial for understanding market behavior, as different global sessions (US, European, Asian) exhibit distinct characteristics in terms of volatility, volume, and price action. This indicator allows traders to:
Identify Session Highs and Lows: Track the boundaries of each trading session to spot key support/resistance levels
Monitor Opening Range Breakouts: Capture the first 5, 15, or 30 minutes of major exchange openings to identify early directional bias
Analyze Multi-Session Patterns: View up to 4 concurrent or sequential sessions with full historical data
Customize Visual Analysis: Tailor colors, styles, and overlays for each session independently
Key Features
Multi-Session Support
Configure up to 4 independent trading sessions (US, Europe, Asia, Custom)
Fully customizable session times with timezone support (UTC offset, Chart timezone, or Exchange timezone)
Daylight Savings Time adjustment for accurate session timing
Session range boxes with adjustable transparency and outline styles
Historical session tracking (1-20 previous sessions)
Opening Range Breakout (ORB)
Track Opening Range for major exchanges: NYSE, LSE, TSE, TSX, ASX, HKEX, SSE
Configurable ORB periods: 5-minute, 15-minute, or 30-minute ranges
Visual ORB boxes with customizable colors and outline styles
ORB High/Low lines with optional extension beyond session close
Individual color control for each session's ORB
Session Analytics
Session High/Low: Horizontal lines marking the session's price extremes
Trendline: Linear regression trendline showing session directional bias
Mean: Session average price for mean reversion analysis
VWAP: Volume-weighted average price for institutional level analysis
Range Boxes: Visual representation of each session's price range
Advanced Customization
Individual Color Pickers: Set unique colors for each overlay type per session
Line Styles: Choose between Solid, Dashed, or Dotted for all line types
Label Options: Customize labels to show Date (d/M), Day of Week (ddd), and/or Price
Extend Options: Extend Session H/L and ORB lines beyond current bar
Outline Styles: Independent control of Range and ORB outline appearance
Information Dashboard
Optional real-time dashboard displaying:
Session Status: Open/Closed indicator for each session
Trend: R² correlation coefficient showing directional strength
Volume: Cumulative session volume
σ (Sigma): Session standard deviation for volatility analysis
Range: Session High, Low, and Range in points
ORB: Opening Range High, Low, and Range in points
Dashboard is fully customizable with toggleable columns and adjustable size/position.
Flexible Configuration
Time Zone Management: Three modes for precise session timing
Historical Display: Show/hide previous sessions for cleaner charts
Label Customization: Independent label size and content options for Session H/L vs ORB
Range Settings: Adjustable transparency, outlines, and label positioning
Use Cases
Session Traders: Identify when specific markets are most active and volatile
ORB Traders: Capture early session momentum and breakout opportunities
Support/Resistance: Use session highs/lows as key price levels
VWAP Strategies: Track institutional activity through session VWAP
Multi-Market Analysis: Monitor overlap between global trading sessions
Default Configuration
The indicator comes pre-configured with US (NYSE), Europe (LSE), and Asia (TSE) sessions, making it immediately useful for forex, indices, and global equity traders. Session D is available for custom session requirements.
Perfect for day traders, scalpers, and swing traders who rely on session-based analysis and institutional order flow.

Session Range Boxes GR v2.1This indicator draws intraday range boxes for the main Forex sessions based on Europe/Budapest time (CET/CEST).
Tracked sessions (Budapest time):
Asia: 01:00 – 08:00
Frankfurt (pre-London): 08:00 – 09:00
London: 09:00 – 18:00
New York: 14:30 – 23:00
For each session, the script:
Detects the session start and session end using the current chart timeframe and the Europe/Budapest time zone.
Tracks the high and low of price during the session.
Draws a colored box from session open to session close, covering the full price range between the session high and low.
Draws a white midline inside every box at the midpoint between the session high and low (and keeps it visible for all past sessions).
Optionally plots a small label (“Asia”, “Fra”, “London”, “NY”) above the first bar of each session.
Color scheme:
Asia: soft orange box
Frankfurt: light aqua box
London: darker blue box
New York: light lime box
Use this tool to:
Quickly see which session created the high or low of the day,
Highlight important liquidity zones and prior session ranges that price may revisit,
Visually separate Asia, Frankfurt, London and New York volatility profiles on intraday charts.
Optimized for intraday trading (Forex / indices), but it works on any symbol where session behavior and time-of-day structure matter.

Session Breakout, Retest, Reversal + Large Move Alert## **Session Breakout, Retest, Reversal + Large Move Alert**
### Overview
A powerful multi-functional indicator designed for day traders and futures traders to identify session-based breakout opportunities, retest confirmations, and significant price movements across all futures contracts (Gold, E-mini S&P 500, Nasdaq, Crude Oil, and more).
### Key Features
**📊 Pre-Market Session Tracking**
- Automatically calculates pre-market/overnight session highs and lows
- Displays session ranges with customizable colors and styling
- Extends lines through the entire trading session for easy reference
- Supports overnight sessions (e.g., 4 PM – 7:30 AM for Gold futures)
**🚀 Breakout Detection**
- Identifies breakouts above/below pre-market highs and lows
- Uses close-price confirmation to filter false signals from wicks
- Displays "BO ↑" and "BO ↓" labels at breakout points
- Generates instant alerts when breakouts occur
**♻️ Retest Failed Tracking**
- Monitors price retests after breakouts
- Detects when retests fail to reach previous support/resistance
- Labels "RF" (Retest Failed) for high-probability trade setups
- Helps identify reversal opportunities
**📈 First 5-Minute Analysis**
- Captures first 5 minutes of market open (customizable timeframe)
- Tracks first 5-minute highs and lows separately
- Essential for mean-reversion and breakout confirmation strategies
- Blue lines extend through the trading session for easy tracking
**⚡ Large Move Alerts**
- Detects significant price movements based on point thresholds
- Individual thresholds for 5+ different symbols:
- GC (Gold): 15 points
- ES (E-mini S&P 500): 15 points
- NQ (E-mini Nasdaq): 50 points
- CL (Crude Oil): 1.5 points
- Custom: Fully adjustable
- Auto-detects symbol from chart ticker
- Labels show exact point movement and candle direction
### Customization Options
**Symbol Configuration**
- **Auto-Mode**: Automatically detects trading symbol from chart ticker
- **Manual-Mode**: Select specific symbol (GC, ES, NQ, CL, or Custom)
**Session Settings**
- Fully customizable pre-market session time (24-hour format)
- Adjustable market open time for first 5-minute window
- Market close hour and minute configuration
- Support for any timezone
**Point Move Thresholds by Symbol**
- Set independent thresholds for each of your trading symbols
- Quickly adjust settings when switching between different futures
- Includes helpful tooltips for recommended values
**Display & Styling**
- Toggle all visual elements on/off individually
- Customizable colors for all lines and labels:
- Pre-market high/low colors
- Breakout labels (up/down)
- Retest failed labels
- First 5-minute session lines
- Large move indicators
- Text size options: tiny, small, normal, large, huge
### How It Works
1. **Session Tracking**: The indicator identifies your pre-market session and marks the high and low with labeled lines (PH/PL)
2. **Breakout Signal**: Once the market opens, it monitors for close prices above/below the pre-market levels and alerts you with "BO ↑" or "BO ↓"
3. **Retest Confirmation**: After a breakout, it tracks retests and labels "RF" when the retest fails to reach the opposite extreme, confirming trade direction
4. **Large Move Detection**: Simultaneously monitors for significant point moves that exceed your symbol-specific thresholds
5. **Alert Triggers**: Get real-time alerts for:
- Breakout Up/Down
- Any Breakout
- Large Move events
### Alert Conditions
The indicator includes four alert conditions:
- **Breakout Up Alert**: Price closes above pre-market high
- **Breakout Down Alert**: Price closes below pre-market low
- **Any Breakout Alert**: Either breakout condition triggers
- **Large Move Alert**: Point movement exceeds threshold for current symbol
### Ideal For
- ✅ Day traders (breakout/retest strategies)
- ✅ Futures traders (Gold, Oil, Stock Index Contracts)
- ✅ Intraday scalpers (first 5-minute analysis)
- ✅ Swing traders (session-based levels)
- ✅ Multi-symbol traders (independent thresholds per symbol)
### Disclaimer
This indicator is designed for educational and informational purposes. Past performance does not guarantee future results. Always use proper risk management and position sizing. Test thoroughly on historical data before trading live.

SJ Fx Session RangeSJ Fx Session Range Indicator
A Professional Forex Session Tracking Tool with Opening Range Analysis
Overview
The SJ Fx Session Range indicator is a comprehensive tool designed to help forex traders visualize major trading sessions (Asia, Europe+London, and New York) along with their first 15-minute opening ranges. Built with Pine Script v5, this indicator provides clear session boundaries, high/low ranges, and customizable opening range analysis to enhance your trading decisions.
Key Features
1. Trading Session Boxes
- Three major forex sessions: Asia, Europe+London, and New York
- Color-coded session boxes with transparent backgrounds for easy visualization
- Automatic session high/low tracking
- Session labels displayed inside boxes for quick identification
- Displays up to 50 historical sessions for pattern analysis
2. Opening Range Analysis
- Tracks first 15-minute opening range for Europe, London, and NY sessions
- Plots high, low, and mid-range levels
- Customizable line colors for each session's opening range
- Background highlights during the first 15 minutes of each session
- Helps identify potential breakout or reversal zones
3. Daylight Saving Time Support
- Built-in DST toggle for easy seasonal adjustment
- Automatically adjusts all session timings by 1 hour when enabled
- Clear tooltip instructions for when to enable/disable DST
- Default timings configured for IST timezone (Asia/Kolkata)
4. User-Friendly Design
- Clean input interface organized by session categories
- Fixed optimal settings for boxes and lines (50-day history)
- All session times are easily customizable with helpful tooltips
- Warning tooltips to prevent accidental timing changes
Default Session Times (when DST is disabled)
- Asia Session: 04:00 - 12:30 IST
- Europe + London Session: 12:30 - 20:00 IST
- New York Session: 20:00 - 02:30 IST
How to Use
1. Add to Chart: Apply the indicator to any forex pair chart
2. Adjust DST: Enable the "Start Daylight Saving Time Change" checkbox on the second Sunday in March; disable on the first Sunday in November
3. Customize Sessions: Toggle individual sessions on/off based on your trading preference
4. Opening Range Colors: Customize the opening range line colors for better visibility
5. Session Times: Default times are optimized for IST; modify only if trading from a different timezone
Technical Specifications
- Version: Pine Script v5
- Overlay: Yes (draws directly on price chart)
- Maximum Objects: 500 boxes, 500 lines
- History: 50 days of session data
- Timezone: Asia/Kolkata (IST) - customizable in code
Use Cases
- Identify high-liquidity trading periods
- Track session volatility patterns
- Monitor opening range breakouts/breakdowns
- Analyze session-specific price action
- Plan entries around major session opens
- Avoid trading during low-liquidity periods
Performance
Optimized for efficient rendering with:
- Fixed 50-day history limit for optimal performance
- Automatic cleanup of old session boxes and lines
- Lightweight code structure for fast chart loading
Customization Options
Available Inputs:
- Enable/disable individual sessions
- Adjust session timings (with safety tooltips)
- Toggle DST on/off
- Show/hide opening range analysis
- Customize opening range line colors for each session
Fixed for Optimal Performance:
- Session box colors (Asia: Aqua, Europe: Green, NY: Red)
- 50-day historical display
- Line width and style
- Mid-range line always displayed
Educational Value
This indicator helps traders:
- Understand forex market structure and session overlaps
- Recognize high-probability trading times
- Develop session-based trading strategies
- Improve timing of trade entries and exits
Open Source License
This script is published under Mozilla Public License 2.0, allowing you to:
- Use freely for personal trading
- Modify and adapt to your needs
- Learn from the code structure
- Share improvements with the community
Credits
Developed by Shantanu Joshi
- Designed for forex traders focusing on session-based strategies
- Built with clean, well-documented Pine Script v5 code
- Regular updates and improvements based on user feedback
Support & Feedback
If you find this indicator useful:
- Give it a thumbs up
- Share your trading results in the comments
- Suggest improvements or new features
- Report any issues for quick resolution
Disclaimer
This indicator is for educational and informational purposes only. It does not constitute financial advice. Always conduct your own research and risk management before making trading decisions. Past performance does not guarantee future results.
Compatible with: CFDs of forex pairs, commodities, indices, and crypto.
Best used on: 5-minutes
Recommended chart type: Candlestick charts

Apex FX - 1st 4H CandleApex FX - 1st 4H Candle
Overview
This indicator identifies the very first 4-hour candle of the trading day and plots its high and low as horizontal lines. These levels are designed to act as key support and resistance for the rest of the 24-hour session.
The lines are calculated using 4-hour data but display on any timeframe, allowing you to see these key daily levels while trading on lower timeframes like the 15-minute or 5-minute chart. The lines extend for the first six 4-hour candles (24 hours) before stopping.
Features
Flexible Timezone: A simple dropdown menu to select your local timezone (e.g., "America/New_York", "Europe/London", "UTC") to ensure the candle is always correctly identified.
Asset Presets: Instantly set the correct start time for major asset classes:
Forex (23:00)
Indices (00:00)
Crypto (21:00)
Fully Custom: A "Custom" option lets you define any hour and minute for the start of your session, giving you full control for other assets like Gold or Oil.
Custom Colors: Change the color of the high and low lines from the settings menu.
How to Use
Add the indicator to your chart.
Open the indicator's "Settings".
In the "Your Timezone" dropdown, select the same timezone you use for your chart (e.g., "America/New_York").
In the "Asset Type Preset" dropdown, choose the asset you are trading (e.g., "Indices").
The indicator will wait for the first 4-hour candle (e.g., the 00:00 candle for Indices) to close, and then it will automatically draw the high and low lines.

IRONBULL FX Venom [TradeFinder] SMC NY Session 2025Setup📌 IRONBULL FX VENOM TRADER
Overview:
The IRONBULL FX VENOM TRADER is a premium Smart Money Concepts (SMC)-based indicator built for institutional-style trading in the New York session. Powered by advanced order block refinement, fair value gap (FVG) detection, and session-based logic, this tool helps traders identify high-probability trading zones and mitigate market noise.
🔧 Key Features:
Order Block Refinement Engine
Integrates with advanced refining logic to filter institutional demand/supply zones, with both Defensive and Aggressive refinement modes.
Fair Value Gap (FVG) Filtering
Detects and highlights FVGs with dynamic filtering options, from Very Aggressive to Very Defensive levels.
Mitigation Levels Control
Allows users to select Proximal, 50%, or Distal levels for precise reaction zones within both OBs and FVGs.
CISD Detection
Captures key short-term displacement shifts, showing potential reversal or continuation signals with optional visual cues.
NY Session Logic
Includes built-in logic to align trades with the New York Opening Range (08:00–09:30 EST) and NY Trading Hours (09:30–17:00 EST). Key session highs/lows are tracked and labeled automatically.
Visual Clarity
Fully customizable color schemes for demand/supply OBs, FVGs, and CISD levels, with lightweight rendering for real-time performance.
🧠 Ideal For:
SMC/ICT-based traders
New York session scalpers and intraday traders
Traders seeking clean institutional zone mapping
Anyone needing visual confirmation of OB + FVG confluence
⚙️ How to Use:
Enable the indicator on a chart (preferably with NY session timezone).
Adjust refinement, FVG filters, and display settings based on your strategy.
Use the OB and FVG zones as key confluence areas for entries/exits.
Watch for CISD labels and session breakouts for high-confidence setups.
Disclaimer: This tool is for educational purposes and not financial advice. Always test in a demo environment before live trading.

LucciThis indicator identifies trade setups based on session liquidity levels and price structure analysis during New York trading sessions.
Unlike basic support/resistance indicators, this system tracks untested session extremes and monitors their interaction with price. It combines break-and-retest mechanics with bounce detection at key liquidity zones, providing multiple entry methodologies within a single framework.
METHODOLOGY:
The system maps high/low points from each trading session (Asia: 6PM-3AM, London: 3AM-8AM, NY: 8AM-5PM EST) and monitors price behavior around these levels. It identifies two primary setup types: momentum continuation after level breaks and reversal bounces at untested extremes. Visual differentiation shows which levels remain untested (darker) versus swept levels (lighter).
SETUP IDENTIFICATION:
Break & Retest Signals:
- Detects breaks of NY Open range (15-minute candle at 8:00 AM EST)
- Waits minimum bars after break before validating retest
- Triggers when price returns to level within tolerance zone
Bounce Signals:
- Identifies approaches to untested session highs/lows
- Optional wick confirmation for reversal validation
- Signals when price rejects from liquidity zone
CONFIGURATION OPTIONS:
Entry Parameters:
- Min Bars After Break: 1-10 (delay before retest valid)
- Retest Tolerance: 0.1-10 points (precision of level test)
- Bounce Zone: 0.5-5 points (distance from level)
- Wick Confirmation: On/off reversal filter
Risk Management:
- Risk Reward Options: 1:3, 1:5, or Custom (1:1 to 1:10)
- Stop Loss: Configurable in points
- Max Daily Signals: 1-5 trade limiter
- Trading Hours: Customizable active window
Visual Elements:
- Session Levels: Orange (Asian), Yellow (London), Blue (NY)
- Signal Markers: Triangles (B&R), Diamonds (Bounce)
- TP/SL Lines: Automatic calculation and display
- Info Table: Shows bias, untested levels, daily signals
OPTIMAL USAGE:
Trading Windows:
- 9:30-11:00 AM EST: Primary trading window
- First touch of untested levels: Highest probability
- 15-minute timeframe: Recommended for futures
- Volume filter: Optional quality enhancement
Signal Prioritization:
- Untested levels provide stronger reactions
- Multiple confirmations increase probability
- Respect market structure and session context
- Combine with volume for filtering
TECHNICAL SPECIFICATIONS:
- Multi-timeframe: Uses 15-minute data for NY Open
- Session-based: Resets levels at session transitions
- Alert system: Detailed messages with levels
- Position tracking: Manages active trades visually
IMPORTANT NOTES:
This tool maps liquidity zones based on session extremes and price structure. No trading system guarantees profits. Combine with market context and proper risk management. Designed for active intraday trading on liquid instruments.
The indicator provides objective level identification while requiring trader discretion for optimal results.

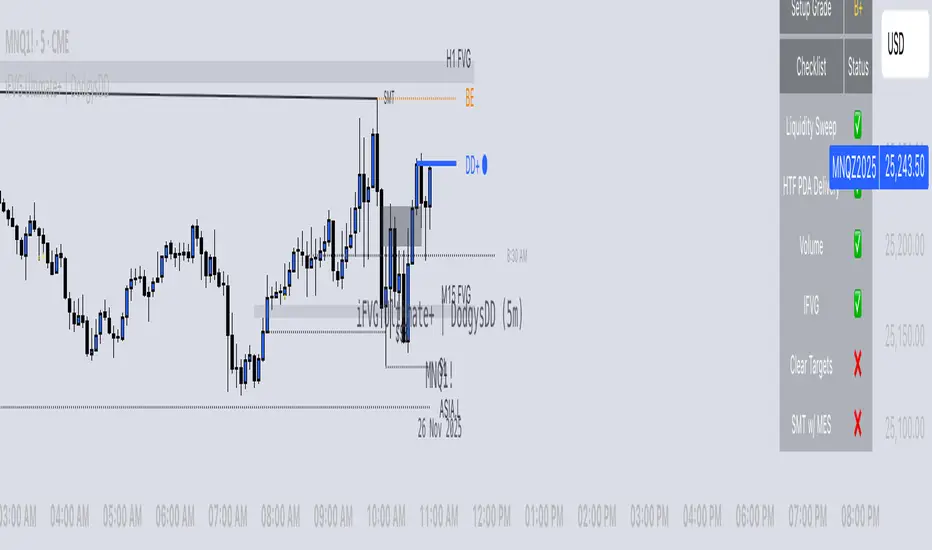
iFVG Ultimate+ | DodgysDDOVERVIEW
iFVG Ultimate+ | DodgysDD is a professional-grade visualization framework that automates the identification and management of Inversion Fair Value Gaps (IFVGs)
It is designed for analysts and educators studying institutional price behavior, liquidity dynamics, and displacement-based imbalances.
This indicator does not provide trading signals or forecasts.
All logic serves educational and analytical purposes only.
A Fair Value Gap (FVG) appears when strong directional displacement prevents candle bodies from overlapping.When a liquidity sweep occurs and price later closes through that gap, the imbalance is considered inverted. This often marks a shift in order-flow.
iFVG Ultimate+ tracks these transitions using a rule-based sequence:
Liquidity Sweep – Price sweeps a previous swing high or low.
Displacement – Body-to-body gap forms as price accelerates away.
Inversion – Full candle body closes through the gap after raid.
Validation and Tracking – Confirmed inversions are stored and managed until completion or invalidation.
-----------------------------------------------------------------------------------------------
PURPOSE AND SCOPE
-----------------------------------------------------------------------------------------------
The framework serves as a research tool to document and analyze IFVG behavior within liquidity and session contexts.
It is commonly used to:
-Record and journal IFVG formations for back-testing and model study.
-Assess how often gaps complete or invalidate after sweeps.
-Evaluate session-based patterns (London, Asia, New York).
-Overlay HTF PD Arrays to observe inter-timeframe delivery.
-Receive custom alerts to your phone
-----------------------------------------------------------------------------------------------
LOGIC STRUCTURE
-----------------------------------------------------------------------------------------------
iFVG Ultimate+ runs a five-stage validation process to ensure sequential, non-repainting behavior.
Liquidity Framework:
• Detects swing highs and lows on aligned timeframes (automatic or manual selection).
• Logs session highs/lows for Asia (20:00–00:00 NY) and London (02:00–05:00 NY).
• Includes data wicks around 08:30 NY for event reference.
FVG Detection and Displacement Filter:
• Identifies body-based imbalances using ATR-scaled sensitivity modes (Sensitive / Normal / Strict).
• Supports “Single” or “Series” modes to merge adjacent gaps.
• Excludes weak displacements using minimum ATR thresholds.
Inversion Validation:
• Confirms only when a complete candle body closes through a qualifying FVG within a user-defined window (6 or 15 bars).
• Duplicate detections are ignored; mitigation states are recorded.
HTF Context Integration:
• Maps higher-time-frame PD Arrays and tracks their delivery status.
• Labels active zones (e.g. “H4 PDA”) and updates on HTF close.
Model Lifecycle and Limits:
• Plots the inversion line and derives educational limit levels: Break-Even and Stop-Loss.
• Tracks until opposing liquidity is swept (model complete) or an invalidation event occurs.
-----------------------------------------------------------------------------------------------
COMPONENTS AND VISUALS
-----------------------------------------------------------------------------------------------
-IFVG Line — Marks confirmed inversion at close.
-Break-Even / Stop-Loss Lines — Calculated retrospectively for journal grading.
-Session High/Low Markers — London and Asia reference levels.
-Data Wicks — 8:30 NY “DATA.H/L” labels for event volatility.
-SMTs — Compares current symbol to correlated instrument for divergence confirmation.
-Checklist Panel — Tracks liquidity, momentum, HTF delivery, and SMT conditions.
-Setup Grade Display — Computes qualitative score (A+ to C) based on met conditions.
-----------------------------------------------------------------------------------------------
INPUT CATEGORIES
-----------------------------------------------------------------------------------------------
General — Detection mode, ATR strictness, bias filter, long/short window.
Liquidity — Automatic or manual timeframe alignment, session visuals.
FVG — Color themes, label sizes, inversion color change, HTF inclusion.
Entry / Limits — Enable or hide Entry, Break-Even, and Stop-Loss levels.
Alerts — Individual toggles for IFVG formation, session sweeps, multi-TF inversions, and invalidations.
Display — Info Box, relationship table, and grade styling.
All alerts output plain text messages only and do not execute orders.
-----------------------------------------------------------------------------------------------
ALERT FRAMEWORK
-----------------------------------------------------------------------------------------------
When enabled, alerts may notify for:
-Potential inversion detected.
-Confirmed IFVG formation.
-Liquidity sweeps (high/low or session).
-Multi-time-frame inversion.
-Invalidation or close warning.
-Alerts serve as educational markers only, not trade triggers.
The user will have the ability to create custom messages for each of these alert events.
-----------------------------------------------------------------------------------------------
USAGE GUIDELINES
-----------------------------------------------------------------------------------------------
iFVG Ultimate+ is suited for review and documentation of displacement-based price behavior.
Recommended educational workflows:
-Annotate IFVG events and review delivery into PD Arrays.
-Analyze frequency by session or timeframe.
-Assess how often IFVGs complete versus invalidate.
-Teach ICT-style liquidity mechanics in mentorship or training contexts.
-The indicator works across forex, futures, and crypto markets.
-----------------------------------------------------------------------------------------------
OPERATIONAL NOTES AND LIMITATIONS
-----------------------------------------------------------------------------------------------
-HTF calculations finalize on bar close (no look-ahead).
-ATR filter strength affects small-gap visibility.
-Session windows use New York time.
-Break-Even and Stop-Loss lines are visual aids only.
-Performance depends on chart density and bar count.
-No strategy module or backtest engine is included.
-----------------------------------------------------------------------------------------------
ORIGINALITY AND PROTECTION
-----------------------------------------------------------------------------------------------
iFVG Ultimate+ | DodgysDD integrates multiple independent systems into a single engine:
-PD Array context alignment with liquidity tracking.
-Dynamic session detection and macro data integration.
-Sequential IFVG validation pipeline with grade assignment.
-Multi-time-frame SMT confirmation module.
-Structured alerts and mitigation tracking.
The logic is entirely original, written in Pine v6, and protected as invite-only to preserve methodology integrity.
-----------------------------------------------------------------------------------------------
ATTRIBUTION
-----------------------------------------------------------------------------------------------
Core concepts such as Fair Value Gaps, Liquidity Sweeps, PD Arrays, and SMT Divergence are publicly taught within ICT-style market education. This implementation was designed and engineered by TakingProphets as iFVG Ultimate+ | DodgysDD, authored for TradingView publication by TakingProphets.
-----------------------------------------------------------------------------------------------
TERMS AND DISCLAIMER
-----------------------------------------------------------------------------------------------
This indicator is for educational and informational use only. It does not provide financial advice or predictive output. Historical patterns do not guarantee future results. All users remain responsible for their own decisions.Use of this script implies agreement with TradingView’s Vendor Requirements and Terms of Use.
-----------------------------------------------------------------------------------------------
ACCESS INSTRUCTIONS
-----------------------------------------------------------------------------------------------
Access is managed through TradingView’s invite-only framework. Users request access via private message to TakingProphets or access link
ICT Sessions With BOS [TradeWithRon]
WITH BOS
This version includes BOS with filter for each session.
NONE,FVG,CISD Filter preset
you can choose how many BOS per session, style etc.
ICT Sessions and killzones maps three intraday sessions on your chart (Asia, London, NY), tracks each session’s live high/low, draws optional session range boxes, and projects ICT OTE zones in real time—with granular styling, touch/mitigation logic, and alerting.
What it does
*Live Session high/low tracking.
Historical session lines:
When a session ends, its final High/Low are preserved as tracked lines (with optional labels) for a configurable number of recent sessions.
Session boxes (ranges):
Draws a shaded box from session start to end that expands with new highs/lows. Limit how many recent boxes remain on chart.
ICT OTE zones (live):
For the currently active session, projects user-defined Fibonacci OTE levels (e.g., 61.8%, 70.5%, 78.6) between the session’s running high and low. Zones update tick-by-tick and can show labels. You can retain a history of recent sessions’ OTE levels.
snapshot
Break visualization (mitigation):
Optionally color the bar when price breaks a stored session High/Low. You can:
Require a body close through the level (vs. any touch)
Auto-remove the line and/or label on touch/close
Use custom break colors per session and side (high/low)
Timestamps:
Add up to two recurring vertical timestamp markers (e.g., 08:00, 09:30), plus an opening horizontal marker (e.g., 09:30) with label that extends until the next occurrence.
Alerts:
Built-in alerts for:
Touch of Session 1/2/3 High/Low (Asia/London/NY)
Touch of OTE levels (per session)
Key inputs:
Time & Limits
Timezone (e.g., GMT-4)
Timeframe limit: hide all drawings on and above a specified TF
Sessions
Session windows (default):
Session 1 (Asia): 18:00–00:00
Session 2 (London): 00:00–06:00
Session 3 (NY): 08:00–12:00
How many to keep (lines/boxes)
Line width, colors, and label suffixes (“High”/“Low”)
Labels: toggle, text (“Asia”, “London”, “NY”), size, and colors
Boxes: toggle per session and background colors
ICT OTE Zones
Toggle per session (Asia/London/NY)
Levels (comma-separated %s, e.g., 61.8,70.5,78.6)
History: number of past sessions to retain
Opacity, line width/style, and label size
Custom label text per session (e.g., “Asia OTE”)
Break/Mitigation Behavior:
Enable Mitigated Candles (bar color on break)
Remove line on touch and/or remove label on touch
Require body close (vs. wick touch)
Custom break colors by session and side
Timestamps
Opening horizontal line (time, style, width, color, label text/size, drawing limit)
Two vertical timestamps (times, style, width, color, drawing limit)
Alerts
Master Enable Alerts
Per-session toggles for High/Low touches
OTE touch alerts
How it works (under the hood)
Detects session state via input.session() windows in the chosen timezone.
Live session High/Low lines and labels update in real time; on session end, final levels are stored with optional labels and tracked length.
OTE zones are live-computed from current session High↔Low and refreshed every bar; a compact rolling history is enforced.
Bar coloring reacts to break events (touch or body-close, per your setting) and uses session-specific colors when enabled.
Timestamp lines/labels are created on each occurrence and trimmed to a drawing limit for performance.
Tips:
To hide session lines but keep boxes, set line color opacity to 0.
Use Timeframe Limit to keep higher-TF charts clean.
Fine-tune OTE Levels and History to balance clarity and performance.
For stricter break logic, enable Require Body Close.
Note: The script reserves high limits for lines/labels/boxes to keep recent context visible while managing cleanup automatically. Adjust “Session Number” and “Number Of Boxes” to suit your workflow.
— © TradeWithRon
ICT Sessions [TradeWithRon]
ICT Sessions and killzones maps three intraday sessions on your chart (Asia, London, NY), tracks each session’s live high/low, draws optional session range boxes, and projects ICT OTE zones in real time—with granular styling, touch/mitigation logic, and alerting.
What it does
Live Session high/low tracking.
Historical session lines:
When a session ends, its final High/Low are preserved as tracked lines (with optional labels) for a configurable number of recent sessions.
Session boxes (ranges):
Draws a shaded box from session start to end that expands with new highs/lows. Limit how many recent boxes remain on chart.
ICT OTE zones (live):
For the currently active session, projects user-defined Fibonacci OTE levels (e.g., 61.8%, 70.5%, 78.6) between the session’s running high and low. Zones update tick-by-tick and can show labels. You can retain a history of recent sessions’ OTE levels.
Break visualization (mitigation):
Optionally color the bar when price breaks a stored session High/Low. You can:
Require a body close through the level (vs. any touch)
Auto-remove the line and/or label on touch/close
Use custom break colors per session and side (high/low)
Timestamps:
Add up to two recurring vertical timestamp markers (e.g., 08:00, 09:30), plus an opening horizontal marker (e.g., 09:30) with label that extends until the next occurrence.
Alerts:
Built-in alerts for:
Touch of Session 1/2/3 High/Low (Asia/London/NY)
Touch of OTE levels (per session)
Key inputs:
Time & Limits
Timezone (e.g., GMT-4)
Timeframe limit: hide all drawings on and above a specified TF
Sessions
Session windows (default):
Session 1 (Asia): 18:00–00:00
Session 2 (London): 00:00–06:00
Session 3 (NY): 08:00–12:00
How many to keep (lines/boxes)
Line width, colors, and label suffixes (“High”/“Low”)
Labels: toggle, text (“Asia”, “London”, “NY”), size, and colors
Boxes: toggle per session and background colors
ICT OTE Zones
Toggle per session (Asia/London/NY)
Levels (comma-separated %s, e.g., 61.8,70.5,78.6)
History: number of past sessions to retain
Opacity, line width/style, and label size
Custom label text per session (e.g., “Asia OTE”)
Break/Mitigation Behavior:
Enable Mitigated Candles (bar color on break)
Remove line on touch and/or remove label on touch
Require body close (vs. wick touch)
Custom break colors by session and side
Timestamps
Opening horizontal line (time, style, width, color, label text/size, drawing limit)
Two vertical timestamps (times, style, width, color, drawing limit)
Alerts
Master Enable Alerts
Per-session toggles for High/Low touches
OTE touch alerts
How it works (under the hood)
Detects session state via input.session() windows in the chosen timezone.
Live session High/Low lines and labels update in real time; on session end, final levels are stored with optional labels and tracked length.
OTE zones are live-computed from current session High↔Low and refreshed every bar; a compact rolling history is enforced.
Bar coloring reacts to break events (touch or body-close, per your setting) and uses session-specific colors when enabled.
Timestamp lines/labels are created on each occurrence and trimmed to a drawing limit for performance.
Tips:
To hide session lines but keep boxes, set line color opacity to 0.
Use Timeframe Limit to keep higher-TF charts clean.
Fine-tune OTE Levels and History to balance clarity and performance.
For stricter break logic, enable Require Body Close.
Note: The script reserves high limits for lines/labels/boxes to keep recent context visible while managing cleanup automatically. Adjust “Session Number” and “Number Of Boxes” to suit your workflow.
— © TradeWithRon
JK_Traders_Reality_LibLibrary "JK_Traders_Reality_Lib"
This library contains common elements used in Traders Reality scripts
calcPvsra(pvsraVolume, pvsraHigh, pvsraLow, pvsraClose, pvsraOpen, redVectorColor, greenVectorColor, violetVectorColor, blueVectorColor, darkGreyCandleColor, lightGrayCandleColor)
calculate the pvsra candle color and return the color as well as an alert if a vector candle has apperared.
Situation "Climax"
Bars with volume >= 200% of the average volume of the 10 previous chart TFs, or bars
where the product of candle spread x candle volume is >= the highest for the 10 previous
chart time TFs.
Default Colors: Bull bars are green and bear bars are red.
Situation "Volume Rising Above Average"
Bars with volume >= 150% of the average volume of the 10 previous chart TFs.
Default Colors: Bull bars are blue and bear are violet.
Parameters:
pvsraVolume (float) : the instrument volume series (obtained from request.sequrity)
pvsraHigh (float) : the instrument high series (obtained from request.sequrity)
pvsraLow (float) : the instrument low series (obtained from request.sequrity)
pvsraClose (float) : the instrument close series (obtained from request.sequrity)
pvsraOpen (float) : the instrument open series (obtained from request.sequrity)
redVectorColor (simple color) : red vector candle color
greenVectorColor (simple color) : green vector candle color
violetVectorColor (simple color) : violet/pink vector candle color
blueVectorColor (simple color) : blue vector candle color
darkGreyCandleColor (simple color) : regular volume candle down candle color - not a vector
lightGrayCandleColor (simple color) : regular volume candle up candle color - not a vector
@return
adr(length, barsBack)
Parameters:
length (simple int) : how many elements of the series to calculate on
barsBack (simple int) : starting possition for the length calculation - current bar or some other value eg last bar
@return adr the adr for the specified lenght
adrHigh(adr, fromDo)
Calculate the ADR high given an ADR
Parameters:
adr (float) : the adr
fromDo (simple bool) : boolean flag, if false calculate traditional adr from high low of today, if true calcualte from exchange midnight
@return adrHigh the position of the adr high in price
adrLow(adr, fromDo)
Parameters:
adr (float) : the adr
fromDo (simple bool) : boolean flag, if false calculate traditional adr from high low of today, if true calcualte from exchange midnight
@return adrLow the position of the adr low in price
splitSessionString(sessXTime)
given a session in the format 0000-0100:23456 split out the hours and minutes
Parameters:
sessXTime (simple string) : the session time string usually in the format 0000-0100:23456
@return
calcSessionStartEnd(sessXTime, gmt)
calculate the start and end timestamps of the session
Parameters:
sessXTime (simple string) : the session time string usually in the format 0000-0100:23456
gmt (simple string) : the gmt offset string usually in the format GMT+1 or GMT+2 etc
@return
drawOpenRange(sessXTime, sessXcol, showOrX, gmt)
draw open range for a session
Parameters:
sessXTime (simple string) : session string in the format 0000-0100:23456
sessXcol (simple color) : the color to be used for the opening range box shading
showOrX (simple bool) : boolean flag to toggle displaying the opening range
gmt (simple string) : the gmt offset string usually in the format GMT+1 or GMT+2 etc
@return void
drawSessionHiLo(sessXTime, showRectangleX, showLabelX, sessXcolLabel, sessXLabel, gmt, sessionLineStyle)
Parameters:
sessXTime (simple string) : session string in the format 0000-0100:23456
showRectangleX (simple bool)
showLabelX (simple bool)
sessXcolLabel (simple color) : the color to be used for the hi/low lines and label
sessXLabel (simple string) : the session label text
gmt (simple string) : the gmt offset string usually in the format GMT+1 or GMT+2 etc
sessionLineStyle (simple string) : the line stile for the session high low lines
@return void
calcDst()
calculate market session dst on/off flags
@return indicating if DST is on or off for a particular region
timestampPreviousDayOfWeek(previousDayOfWeek, hourOfDay, gmtOffset, oneWeekMillis)
Timestamp any of the 6 previous days in the week (such as last Wednesday at 21 hours GMT)
Parameters:
previousDayOfWeek (simple string) : Monday or Satruday
hourOfDay (simple int) : the hour of the day when psy calc is to start
gmtOffset (simple string) : the gmt offset string usually in the format GMT+1 or GMT+2 etc
oneWeekMillis (simple int) : the amount if time for a week in milliseconds
@return the timestamp of the psy level calculation start time
getdayOpen()
get the daily open - basically exchange midnight
@return the daily open value which is float price
newBar(res)
new_bar: check if we're on a new bar within the session in a given resolution
Parameters:
res (simple string) : the desired resolution
@return true/false is a new bar for the session has started
toPips(val)
to_pips Convert value to pips
Parameters:
val (float) : the value to convert to pips
@return the value in pips
rLabel(ry, rtext, rstyle, rcolor, valid, labelXOffset)
a function that draws a right aligned lable for a series during the current bar
Parameters:
ry (float) : series float the y coordinate of the lable
rtext (simple string) : the text of the label
rstyle (simple string) : the style for the lable
rcolor (simple color) : the color for the label
valid (simple bool) : a boolean flag that allows for turning on or off a lable
labelXOffset (int) : how much to offset the label from the current position
rLabelOffset(ry, rtext, rstyle, rcolor, valid, labelOffset)
a function that draws a right aligned lable for a series during the current bar
Parameters:
ry (float) : series float the y coordinate of the lable
rtext (string) : the text of the label
rstyle (simple string) : the style for the lable
rcolor (simple color) : the color for the label
valid (simple bool) : a boolean flag that allows for turning on or off a lable
labelOffset (int)
rLabelLastBar(ry, rtext, rstyle, rcolor, valid, labelXOffset)
a function that draws a right aligned lable for a series only on the last bar
Parameters:
ry (float) : series float the y coordinate of the lable
rtext (string) : the text of the label
rstyle (simple string) : the style for the lable
rcolor (simple color) : the color for the label
valid (simple bool) : a boolean flag that allows for turning on or off a lable
labelXOffset (int) : how much to offset the label from the current position
drawLine(xSeries, res, tag, xColor, xStyle, xWidth, xExtend, isLabelValid, xLabelOffset, validTimeFrame)
a function that draws a line and a label for a series
Parameters:
xSeries (float) : series float the y coordinate of the line/label
res (simple string) : the desired resolution controlling when a new line will start
tag (simple string) : the text for the lable
xColor (simple color) : the color for the label
xStyle (simple string) : the style for the line
xWidth (simple int) : the width of the line
xExtend (simple string) : extend the line
isLabelValid (simple bool) : a boolean flag that allows for turning on or off a label
xLabelOffset (int)
validTimeFrame (simple bool) : a boolean flag that allows for turning on or off a line drawn
drawLineDO(xSeries, res, tag, xColor, xStyle, xWidth, xExtend, isLabelValid, xLabelOffset, validTimeFrame)
a function that draws a line and a label for the daily open series
Parameters:
xSeries (float) : series float the y coordinate of the line/label
res (simple string) : the desired resolution controlling when a new line will start
tag (simple string) : the text for the lable
xColor (simple color) : the color for the label
xStyle (simple string) : the style for the line
xWidth (simple int) : the width of the line
xExtend (simple string) : extend the line
isLabelValid (simple bool) : a boolean flag that allows for turning on or off a label
xLabelOffset (int)
validTimeFrame (simple bool) : a boolean flag that allows for turning on or off a line drawn
drawPivot(pivotLevel, res, tag, pivotColor, pivotLabelColor, pivotStyle, pivotWidth, pivotExtend, isLabelValid, validTimeFrame, levelStart, pivotLabelXOffset)
draw a pivot line - the line starts one day into the past
Parameters:
pivotLevel (float) : series of the pivot point
res (simple string) : the desired resolution
tag (simple string) : the text to appear
pivotColor (simple color) : the color of the line
pivotLabelColor (simple color) : the color of the label
pivotStyle (simple string) : the line style
pivotWidth (simple int) : the line width
pivotExtend (simple string) : extend the line
isLabelValid (simple bool) : boolean param allows to turn label on and off
validTimeFrame (simple bool) : only draw the line and label at a valid timeframe
levelStart (int) : basically when to start drawing the levels
pivotLabelXOffset (int) : how much to offset the label from its current postion
@return the pivot line series
getPvsraFlagByColor(pvsraColor, redVectorColor, greenVectorColor, violetVectorColor, blueVectorColor, lightGrayCandleColor)
convert the pvsra color to an internal code
Parameters:
pvsraColor (color) : the calculated pvsra color
redVectorColor (simple color) : the user defined red vector color
greenVectorColor (simple color) : the user defined green vector color
violetVectorColor (simple color) : the user defined violet vector color
blueVectorColor (simple color) : the user defined blue vector color
lightGrayCandleColor (simple color) : the user defined regular up candle color
@return pvsra internal code
updateZones(pvsra, direction, boxArr, maxlevels, pvsraHigh, pvsraLow, pvsraOpen, pvsraClose, transperancy, zoneupdatetype, zonecolor, zonetype, borderwidth, coloroverride, redVectorColor, greenVectorColor, violetVectorColor, blueVectorColor)
a function that draws the unrecovered vector candle zones
Parameters:
pvsra (int) : internal code
direction (simple int) : above or below the current pa
boxArr (array) : the array containing the boxes that need to be updated
maxlevels (simple int) : the maximum number of boxes to draw
pvsraHigh (float) : the pvsra high value series
pvsraLow (float) : the pvsra low value series
pvsraOpen (float) : the pvsra open value series
pvsraClose (float) : the pvsra close value series
transperancy (simple int) : the transparencfy of the vecor candle zones
zoneupdatetype (simple string) : the zone update type
zonecolor (simple color) : the zone color if overriden
zonetype (simple string) : the zone type
borderwidth (simple int) : the width of the border
coloroverride (simple bool) : if the color overriden
redVectorColor (simple color) : the user defined red vector color
greenVectorColor (simple color) : the user defined green vector color
violetVectorColor (simple color) : the user defined violet vector color
blueVectorColor (simple color) : the user defined blue vector color
cleanarr(arr)
clean an array from na values
Parameters:
arr (array) : the array to clean
@return if the array was cleaned
calcPsyLevels(oneWeekMillis, showPsylevels, psyType, sydDST)
calculate the psy levels
4 hour res based on how mt4 does it
mt4 code
int Li_4 = iBarShift(NULL, PERIOD_H4, iTime(NULL, PERIOD_W1, Li_0)) - 2 - Offset;
ObjectCreate("PsychHi", OBJ_TREND, 0, Time , iHigh(NULL, PERIOD_H4, iHighest(NULL, PERIOD_H4, MODE_HIGH, 2, Li_4)), iTime(NULL, PERIOD_W1, 0), iHigh(NULL, PERIOD_H4,
iHighest(NULL, PERIOD_H4, MODE_HIGH, 2, Li_4)));
so basically because the session is 8 hours and we are looking at a 4 hour resolution we only need to take the highest high an lowest low of 2 bars
we use the gmt offset to adjust the 0000-0800 session to Sydney open which is at 2100 during dst and at 2200 otherwize. (dst - spring foward, fall back)
keep in mind sydney is in the souther hemisphere so dst is oposite of when london and new york go into dst
Parameters:
oneWeekMillis (simple int) : a constant value
showPsylevels (simple bool) : should psy levels be calculated
psyType (simple string) : the type of Psylevels - crypto or forex
sydDST (bool) : is Sydney in DST
@return
adrHiLo(length, barsBack, fromDO)
Parameters:
length (simple int) : how many elements of the series to calculate on
barsBack (simple int) : starting possition for the length calculation - current bar or some other value eg last bar
fromDO (simple bool) : boolean flag, if false calculate traditional adr from high low of today, if true calcualte from exchange midnight
@return adr, adrLow and adrHigh - the adr, the position of the adr High and adr Low with respect to price
drawSessionHiloLite(sessXTime, showRectangleX, showLabelX, sessXcolLabel, sessXLabel, gmt, sessionLineStyle, sessXcol)
Parameters:
sessXTime (simple string) : session string in the format 0000-0100:23456
showRectangleX (simple bool)
showLabelX (simple bool)
sessXcolLabel (simple color) : the color to be used for the hi/low lines and label
sessXLabel (simple string) : the session label text
gmt (simple string) : the gmt offset string usually in the format GMT+1 or GMT+2 etc
sessionLineStyle (simple string) : the line stile for the session high low lines
sessXcol (simple color) : - the color for the box color that will color the session
@return void
msToHmsString(ms)
converts milliseconds into an hh:mm string. For example, 61000 ms to '0:01:01'
Parameters:
ms (int) : - the milliseconds to convert to hh:mm
@return string - the converted hh:mm string
countdownString(openToday, closeToday, showMarketsWeekends, oneDay)
that calculates how much time is left until the next session taking the session start and end times into account. Note this function does not work on intraday sessions.
Parameters:
openToday (int) : - timestamps of when the session opens in general - note its a series because the timestamp was created using the dst flag which is a series itself thus producing a timestamp series
closeToday (int) : - timestamp of when the session closes in general - note its a series because the timestamp was created using the dst flag which is a series itself thus producing a timestamp series
@return a countdown of when next the session opens or 'Open' if the session is open now
showMarketsWeekends (simple bool)
oneDay (simple int)
countdownStringSyd(sydOpenToday, sydCloseToday, showMarketsWeekends, oneDay)
that calculates how much time is left until the next session taking the session start and end times into account. special case of intraday sessions like sydney
Parameters:
sydOpenToday (int)
sydCloseToday (int)
showMarketsWeekends (simple bool)
oneDay (simple int)

FOREXSOM Session Boxes (Local Time) — Asian, London & New YorkFOREXSOM Session Boxes (Local Time) highlights the three major Forex sessions — Asian, London, and New York — using your chart’s local timezone automatically.
This indicator helps traders visualize market structure, liquidity zones, and timing across global trading hours with accuracy and clarity.
Key Features
Automatically adjusts to your chart’s local timezone
Highlights Asian, London, and New York sessions with clean color zones
Works on all timeframes and asset classes
Ideal for Smart Money Concepts (SMC), ICT, and price action strategies
Helps identify range breakouts, session highs/lows, and liquidity grabs
How It Works
Each session box updates in real time to show the current range as the market develops.
The boxes reset at the end of each session, making it easy to compare volatility and liquidity shifts between regions.
Sessions (default times):
Asian: 17:00 – 03:00
London: 02:00 – 11:00
New York: 07:00 – 16:00
How to Use
Add the indicator to your chart.
Ensure your chart timezone matches your local time in chart settings.
Watch session ranges form and look for liquidity sweeps or breakouts between overlaps (London/New York).
Created by FOREXSOM
Empowering traders worldwide with precision-built tools for Smart Money and institutional trading education.

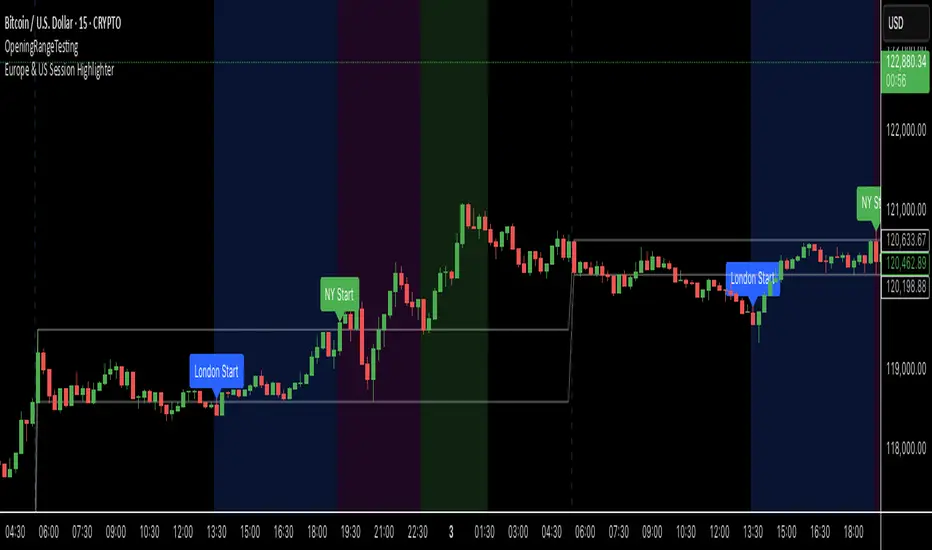
Europe & US Session Highlighter
Bitcoin trading volumes peak during the Europe-US session overlap (13:30–17:00 UTC), driven by institutional activity and market news. This indicator helps traders:
- Focus on high-liquidity periods for better trade execution.
- Avoid low-volume, high-volatility periods outside major sessions.
- Plan entries and exits during Bitcoin’s most active hours.
How to Use:
- Apply the indicator to any Bitcoin intraday chart (e.g., 1M, 5M, 15M).
- Look for blue (London), green (NY), or purple (overlap) backgrounds to identify active sessions.
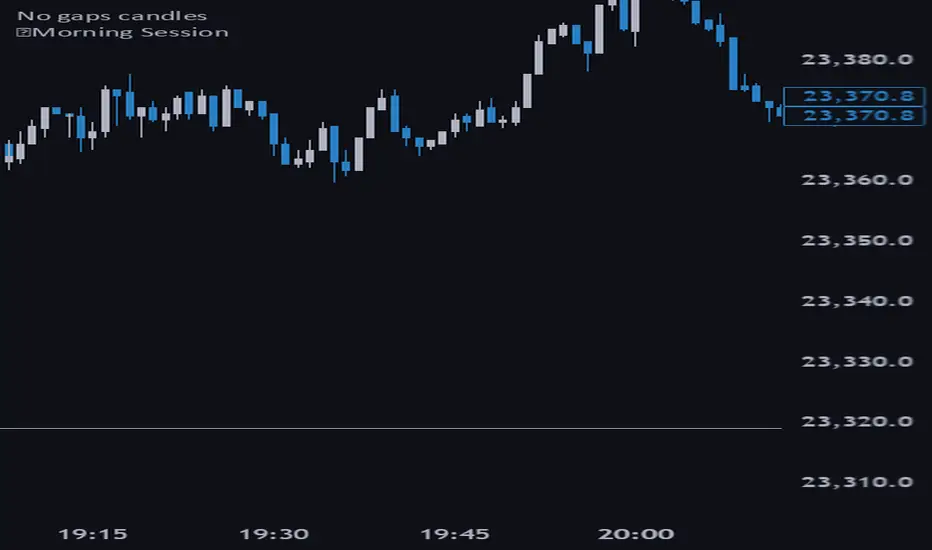
🔵Morning Session📌 Morning Session – TradingView Indicator
The Morning Session highlights the time window between 10:00 – 12:00, a key part of the London session when the market gains volume and volatility. The indicator plots the High of Day (HOD) and Low of Day (LOD) formed during this period, giving traders a clear framework to analyze price action and spot potential trading opportunities.
✔️ Focuses on the most active part of the London session
✔️ Marks critical HOD & LOD levels within the morning range
✔️ Useful for breakout or reversal strategies around session highs and lows
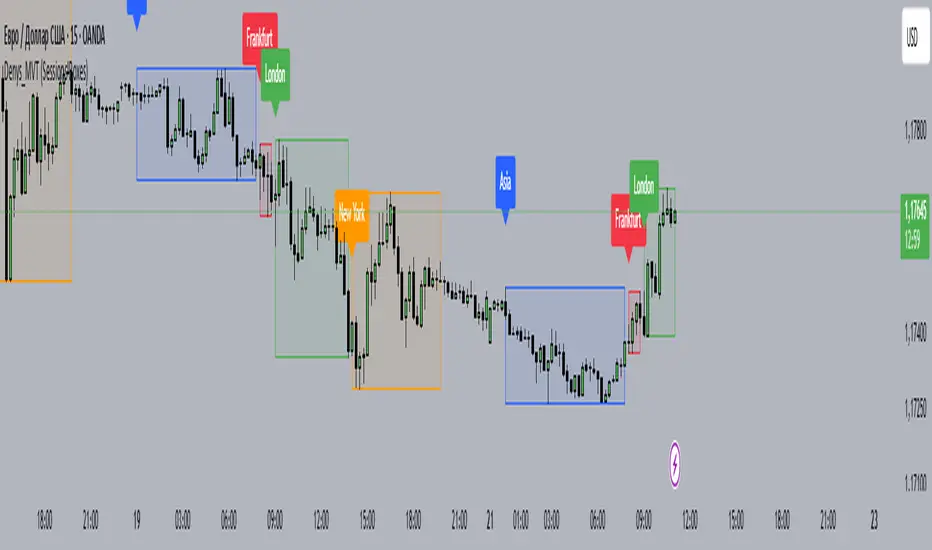
Denys_MVT (Sessions Boxes)Denys_MVT (Sessions Boxes)
This indicator highlights the main trading sessions — Asia, Frankfurt, London, and New York — directly on the chart.
It helps traders visually separate market activity during different times of the day and quickly understand which session is currently active.
🔹 How it works
You can choose between Box Mode (draws a box around the session’s high and low) or Fill Mode (background color for the session).
Each session has its own customizable time range and color.
Labels can be placed automatically at the beginning of each session.
The script uses the time() function with your selected UTC offset to precisely map session times.
🔹 Features
Displays Asia, Frankfurt, London, and New York sessions.
Option to toggle between boxes and background shading.
Adjustable transparency and session colors.
Session labels for easier visual reference.
Works on any symbol and timeframe.
🔹 How to use
Add the indicator to your chart.
Set your local UTC offset in the settings (default: UTC+2).
Enable/disable sessions, change colors, or switch between Box/Fill mode.
Use the session highlights to better understand when volatility typically increases and how different sessions interact.
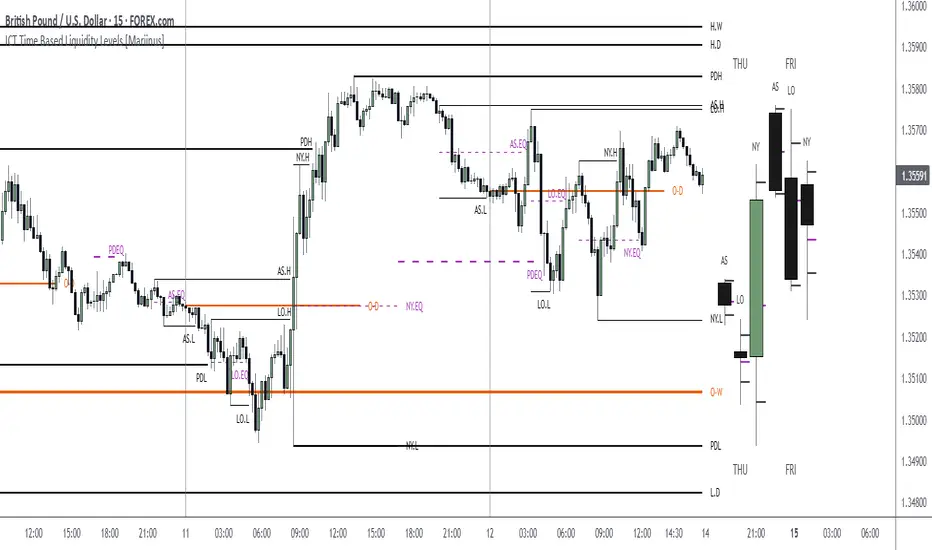
ICT Time Based Liquidity Levels [Mariinus]Indicator Overview – Inspired by ICT Concepts
This indicator helps you spot where liquidity rests and where major price moves are likely to begin or end — giving you clarity for both entries and exits.
Inspired by the teachings of the Inner Circle Trader (ICT), this tool builds on his philosophies and principles that have reshaped how traders view price action. One of the most powerful lessons that stuck with me personally is his quote:
"Time & Price, where it is Time first and then Price”
Another fundamental concept that underpins this tool is the idea that:
"Price is constantly moving in cycles from Premium to Equilibrium, from Equilibrium to Discount from Discount back to Premium."
With these core ideas in mind, this indicator was developed to help traders who are already using an ICT-based framework and focus on Kill Zones and by this on Time Based Liquidity.
In addition to plotting Session Highs and Lows on your chart, the ICT Time Based Liquidity Levels indicator also includes derived levels that provide deeper market insight. These include the Equilibrium of the full Session Range (High to Low) as well as the Equilibrium of the Wicks – offering a more nuanced view of price balance and potential turning points, in line with ICT’s core concepts.
To make sure your chart is not cluttered with lines, you can select which levels to show – and more importantly – you can plot Session Candles next to your Chart. Unlike standard time-based candles (e.g. 4H candles), these are “true” Session Candles that reflect the actual OHLC of trading Sessions, making it easier and clearer to see how Sessions interact with each other.
Next to Intraday Highs and Lows, the indicator will also plot Daily and Weekly Liquidity Pools above and below the Market, giving you insights to where Price is most likely heading towards.
You can set Alerts that trigger whenever one of these key levels is tagged, so you stay focused without staring at the screen all day.
⚠️ Important Disclaimer:
This is not a standalone trading plan.
This is not a buy or sell signal generator.
Instead, this tool is designed to support traders who follow ICT principles by helping them identify higher-probability PD Arrays – the key levels where setups are more likely to occur. If your trading plan includes looking for specific PD Arrays and structural frameworks taught by ICT, then this indicator is a visual aid to refine and focus your attention on the areas where your framework has a higher probability of playing out.
⚙️ Explanation of the Settings
You can combine up to 6 Sessions to monitor their respective levels while operating on a lower timeframe. You can define the timings and a long and short naming of those Sessions.
In the Days Section you can Set a lookback period to control how far back you want to calculate levels. Next to that you can select which Daily and or Weekly Levels you want to have shown on your Charts together with choosing their coloring, style and width.
In the Candles Section you can define how the Session Candles will look like which are plotted next to your Chart. When you have multiple Days of Session Candles it can come in handy to mirror image the Candles which will plot the Candles from right to left instead of the default left to right. In addition you can control how far the distance is between the Candles and your chart, the distance between Candles and Days and the thickness of those Candles. Next you can show or hide the Equilibrium of the total Session Range and the Equilibrium of the Wicks.
In the Lines Section you can specify which Session Levels you want to see on your Chart together with choosing their coloring, style and width.
In the Labels Section you can specify which Labels you want to show and how you want to show them.
In the Openings Section you can specify to show the Midnight Open and or Weekly Open. In addition you can add a divider to be able to distinguish between multiple Days or Weeks.
In the Alert Section you can specify for which Sessions you want to get notified when Key Levels are tagged. After setting this up, you need to set an alert via the Tradingview Alert function to really activate the Alert Function. Be aware that when you change your Alert setup, you need to setup the Tradingview Alert function again.
💡 Example Use Cases
These examples are for educational purposes only. This tool is not financial advice and should always be used in conjunction with your own trading plan—whether it involves Fair Value Gaps, Order Blocks, or a custom combination of ICT-based elements.
Killzones SMT + IFVG detectorKillzones SMT + IFVG Detector
Summary
This strategy implements a specific intraday workflow inspired by ICT-style concepts.
It combines:
Killzone session levels (recording untouched highs/lows)
SMT divergence between NQ and ES (exclusive sweep logic)
IFVG confirmation (3-bar imbalance + width filter + inversion guard)
and an optional smart exit engine
The components are not simply mashed together: they interact in sequence.
A setup only confirms if all conditions line up (time window → untouched level sweep → divergence → valid IFVG → confirmation candle → risk filter).
Workflow
Killzones & session levels
Tracks highs/lows inside default killzones (19:00–23:00, 01:00–04:00, 08:30–10:00, 11:00–12:00, 12:30–15:00, chart timezone).
Stores untouched levels forward; sweeps trigger candidate signals.
SMT divergence (exclusive sweep)
Bullish SMT : one index sweeps its low while the other remains above its session low.
Bearish SMT : one index sweeps its high while the other remains below its session high.
Detection supports “Sweep (Cross)” or “Exact Tick.”
Session IDs are tracked so once a side has fired, later re-touches can’t re-trigger .
IFVG confirmation
Locks the first valid 3-bar IFVG after SMT.
Confirmation requires a candle close beyond the IFVG boundary in the direction of the close.
IFVGs must meet a minimum width filter (default 1.0 point).
Inversion guard: ignores IFVGs already inverted before SMT.
Optional “re-lock” keeps tracking the latest IFVG until confirmation/expiry.
Smart exit engine
Initial stop from opposite wick (+ buffer).
Fixed TP (default 40 points).
Dynamic stop escalation at progress thresholds (BE → 50% → 80% of target).
Safety gates
Weekend lockout (Fri 16:40 → Sun 18:00).
Same-bar sweep of high & low cancels setups.
Max initial stop filter skips oversized setups.
Optional cooldown bars.
Alerts
SMT Bullish/Bearish : divergence detected this bar.
Confirm Long/Short : IFVG confirmation triggered.
Default Strategy Properties (used in screenshots/backtests)
Initial capital: $25,000
Order size: 1 contract
Commission: $1.25 per contract per side
Slippage: 2 ticks
Backtest window: Jun 16, 2025 – Sep 14, 2025
These settings are intentionally conservative. If you change them, your results will differ.
How to use
Apply on an NQ or ES futures chart (1–5 min).
Choose your killzones and detection mode.
Select confirmation symbol (NQ, ES, or “Sweeper”).
Enable/disable IFVG re-lock.
Review signals and use alerts for automation if desired.
Limitations
Strict filters reduce trade count; extend backtest window for more samples.
Works best on NQ/ES; not validated elsewhere.
Past performance is not indicative of future results.
This is an educational tool ; not financial advice.

kings sessions and openEnhanced Liquidity, Sessions & Opens Indicator
📊 What it does:
A comprehensive trading indicator that combines three powerful features to help identify key market levels and timing.
⚡ Core Features:
🔥 Liquidity Sweeps (Default: ON)
Automatically detects pivot highs and lows
Draws horizontal lines at these levels
Removes lines when price "sweeps" the liquidity (breaks through)
Customizable colors, line styles, and maximum number of lines
🌍 Market Sessions (Default: ON)
Highlights major trading sessions: Asia, London, NY AM, NY PM
Shows session high/low levels with colored lines
Customizable session times and colors
Clean session labels without clutter
📈 Key Open Levels (Default: OFF)
Marks important market open times (8:30, 9:30, 10:00, etc.)
Shows horizontal lines at open prices
Customizable labels and lookback period
Optional feature - enable in settings if needed
🎯 Perfect for:
Scalpers looking for liquidity grabs
Day traders tracking session boundaries
Anyone wanting cleaner charts with key levels
Multi-timeframe analysis

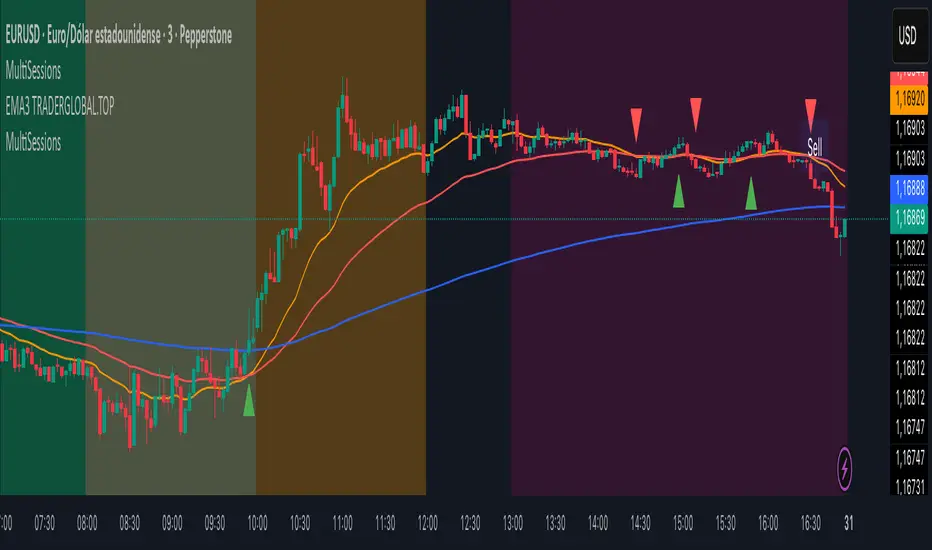
MultiSessions traderglobal.topEste indicador de sesiones está diseñado para traders intradía que desean visualizar con precisión la actividad y la volatilidad característica de cada mercado. Basado en Pine Script v5 y optimizado para la zona horaria “America/New_York”, divide el día en sub-sesiones configurables y resalta sus rangos de precio en tiempo real. En particular, incorpora tres bloques para New York (NY1, NY2, NY3), dos para Londres (LON1, LON2), dos para Tokio (TKO1, TKO2) y mantiene Sídney como sesión opcional. Cada bloque puede activarse o desactivarse de forma independiente y cuenta con su propio color ajustable, lo que permite construir mapas visuales claros para estrategias basadas en horario, solapamientos y micro-estructuras de mercado.
El panel de inputs incluye la opción “Activate High/Low View”. Cuando está activada, el indicador calcula de manera incremental el mínimo y máximo de cada sub-sesión y sombrea el área entre ambos con fill, proporcionando una referencia inmediata del rango intrasesión (útil para medir compresión/expansión y posibles rompimientos). Cuando está desactivada, emplea un simple bgcolor por bloque, ideal para traders que prefieren un gráfico más limpio y solo desean distinguir visualmente los tramos horarios.
La lógica central utiliza dos funciones auxiliares: is_session(sess), que detecta si la vela actual pertenece a un tramo horario concreto, e is_newbar(sess), que determina el inicio de una nueva barra de referencia según la resolución elegida (D, W o M). Gracias a esta combinación, en cada sub-sesión el indicador reinicia sus contadores de alto y bajo al comenzar el período y los actualiza vela a vela mientras el bloque siga activo. Este enfoque evita mezclas de datos entre sesiones y asegura que el rango que se muestra corresponda estrictamente al segmento horario configurado.
Los horarios por defecto están pensados para Forex y contemplan casos que cruzan medianoche (por ejemplo, Tokio 2 y Sídney). Pine Script admite rangos como 2200-0200; no obstante, si tu bróker o la zona horaria del gráfico generan un sombreado parcial, basta con dividir el tramo en dos: 2200-2359 y 0000-0200. Asimismo, cada input.session incluye el patrón :1234567 para habilitar los siete días; puedes restringir días según tu operativa.
En cuanto al uso práctico, el indicador facilita identificar: (1) la estructura del rango por sub-sesión (útil para estrategias de breakout/mean-reversion), (2) los solapamientos entre Londres y New York, donde suele concentrarse la liquidez, y (3) períodos de menor volatilidad (tramos tardíos de Asia o previos a noticias). El color independiente por bloque te permite codificar visualmente la importancia o tu plan de trading (por ejemplo, tonos más intensos en ventanas de alta probabilidad).
Finalmente, su diseño modular hace sencilla la personalización: puedes ajustar colores, activar/desactivar bloques, cambiar horarios y modificar la resolución de reseteo del rango. Como posible mejora, se pueden añadir alertas de ruptura de máximos/mínimos de sub-sesión o etiquetas con la altura del rango (pips) al cierre. Este indicador no sustituye el juicio del trader ni constituye recomendación financiera, pero ofrece una base visual robusta para integrar el factor tiempo en la toma de decisiones.
This sessions indicator is built for intraday traders who want a precise, time-aware view of market activity and typical volatility patterns across the day. Written in Pine Script v5 and optimized for the “America/New_York” timezone, it divides the trading day into configurable sub-sessions and highlights their price ranges in real time. Specifically, it provides three blocks for New York (NY1, NY2, NY3), two for London (LON1, LON2), two for Tokyo (TKO1, TKO2), and keeps Sydney as an optional session. Each block can be enabled or disabled independently and comes with its own adjustable color, letting you build clear visual maps for time-based strategies, overlaps, and microstructure nuances.
In the inputs panel you’ll find the “Activate High/Low View” option. When enabled, the indicator incrementally computes each sub-session’s low and high and shades the area between them with fill, giving you an immediate reference to the intra-session range (useful for gauging compression/expansion and potential breakouts). When disabled, it switches to a clean bgcolor background by block—ideal if you prefer a minimal chart and simply want to distinguish time windows at a glance.
The core logic relies on two helper functions: is_session(sess), which detects whether the current bar falls within a given time window, and is_newbar(sess), which identifies the start of a new reference bar according to your chosen reset resolution (D, W, or M). With this combination, each sub-session resets its high/low at the beginning of the period and updates them bar by bar while the block remains active. This prevents cross-contamination between sessions and ensures the range you see belongs strictly to the configured segment.
Default hours are suited to Forex and include segments that cross midnight (e.g., Tokyo 2 and Sydney). Pine Script supports ranges like 2200-0200; however, if your broker or chart timezone causes partial shading, simply split the segment into two: 2200-2359 and 0000-0200. Each input.session uses the :1234567 suffix to enable all seven days; you can easily restrict days to match your plan.
Practically speaking, the indicator helps you identify: (1) range structure by sub-session (great for breakout or mean-reversion frameworks), (2) overlaps between London and New York, where liquidity and directional moves often concentrate, and (3) lower-volatility windows (late Asia or pre-news lulls). Independent colors per block let you visually encode priority or your trading plan (for example, richer tones in high-probability windows).
Thanks to its modular design, customization is straightforward: adjust colors, toggle blocks, change hours, and tweak the range-reset resolution to suit your routine. As a natural extension, you can add alerts for sub-session high/low breakouts or labels that display the range height (in pips) at session close. While no indicator replaces trader judgment or constitutes financial advice, this tool offers a robust visual foundation for incorporating the time factor directly into your decision-making, helping you contextualize price action within the rhythm of global trading sessions.
LevelsThis Indicator is meant to plot some of the most common levels that traders use.
The display of these levels is highly customizable, as you can choose the line type , color , thickness and whether it shows you no label, price only, reduced label or full label next to the line. All labels (except for "no Label") will show the price at this level.
Also You have the option to mark the start on each timeframe with either a individually colored background or a vertical line where you can choose the line style and color.
Full List of available Levels and Optional inputs to these levels:
Previous HTF Candle Levels:
• Previous HTF Candle Open
• Previous HTF Candle High
• Previous HTF Candle Low
• Previous HTF Candle Close
Optional:
• Choose any higher timeframe
• Mark start of new HTF candle
Session Levels:
• Session Open
• Session High
• Session Low
• Session Close
Optional:
• Choose any time as start and end of your session
• Mark start of session
• Mark full session
Daily Levels:
• Current Day Open
• Current Day High
• Current Day Low
• Previous Day Open
• Previous Day High
• Previous Day Low
• Previous Day Close
Optional:
• Choose start of day (standard, NY Midnight, custom start time)
• Mark start of day
Weekly Levels:
• Current Week Open
• Current Week High
• Current Week Low
• Previous Week Open
• Previous Week High
• Previous Week Low
• Previous Week Close
Optional:
• Mark start of Week
Monthly Levels:
• Current Month Open
• Current Month High
• Current MonthLow
• Previous Month Open
• Previous Month High
• Previous Month Low
• Previous Month Close
Optional:
• Mark start of Month


Accurate Monthly Session HighlighterYou can adjust the start/end times and highlight settings directly from the indicator's input parameters.
